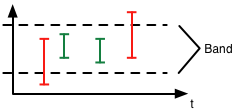
Here we have measurement values denoted by the green and red vertical bars (actually those are aggregates over several values as e.g. seen in the 1h tables). In addition to the values we have a band of 'good' or 'allowed' values (e.g. the typical variation of disk space used).
The measurement values marked in red have outliers outside of the band and thus trigger OOB conditions.
In previous RHQ versions, we were computing the OOB violations against the live data coming into the system, which was expensive on large scale systems. And if you had a violation every minute, the counter was showing you 3600 violations a day - but it did not tell you if those were severe conditions or just tiny little ones.
For the upcoming version of RHQ (or in svn HEAD) we revamped the system in a way that it calculates the OOB conditions from the hourly data table, that already has an aggregation of data from the last hour. Instead of recording the count of OOBs, we are now computing a factor. This is just a number that tells you how severe the violations are. A higher number means more severe. This could come from a one time big violation or from many smaller ones.
The new subsystem view will show you a table about the known OOB violators sorted by severity. You can then go to the individual metrics big charts and if you want also manually set a larger band. Resetting the band will automatically clean out the now obsolete OOBs, as will the automatic recalculation of baselines.
If you want to know more, have a look at the design page and the documentation jira entry.
No comments:
Post a Comment