I was hacking some code and running tests and got:
  testA(org.acme.ATest)  Time elapsed: 0.114 sec  <<< ERROR!
   java.lang.RuntimeException: Could not inject members
   Caused by: java.lang.NullPointerException
No stack trace, no line number, nothing :-(
Attaching a debugger and making it stop on NPE also did not help, as this was slowing execution down to no avail.
Luckily IntelliJ IDEA has a nice feature to just log the exception when it happens. Just go to the breakpoint view in the Debugger and tick the respective checkbox
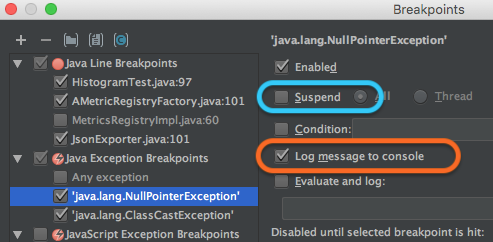
You should also unmark the suspend checkbox as you don't want your porgram being interrupted all the time in places you don't want to know about (I had some hundreds of lines of NPEs within the JRE itself).
When you then attach the debugger to your process, you will see all NPEs along with the place they were thrown. And if the place is within your code, you can navigate to it via the log entry with one click.
I am sure other IDEs have a similar functionality.
